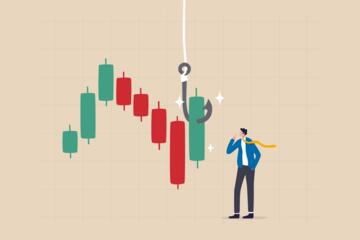
Crisis Alpha vs Normal Returns
Managed futures are typically trend-following strategies that trade futures and other liquid instruments using rules for entering and exiting positions. The marketing language often splits performance into two buckets: “crisis alpha,” meaning gains during stress, and “normal-market returns,” meaning returns during calmer periods. Those buckets can behave differently because trend signals respond to volatility regimes, liquidity, and the persistence of price moves. A manager can show strong crisis performance while still producing mediocre results in range-bound markets, and the reverse can also occur. The practical question for investors is not which label sounds better, but which risk exposures the strategy actually carries across market regimes.
What People Misread In Reports
Many comparisons treat crisis periods as if they were a single, repeatable pattern. In practice, stress episodes differ: some are driven by rapid deleveraging, others by policy shocks, and others by commodity or FX dislocations. Trend-following systems often benefit when price moves persist long enough for signals to mature, which can happen in some crises and not in others. When a manager reports “crisis alpha,” the definition of the crisis window matters as much as the returns themselves.
Another common mistake is mixing strategy-level results with fund-level outcomes without tracking the mechanics. Managed futures funds may use leverage, collateral management, and different execution assumptions than backtests. Even small differences in roll schedules for futures contracts can change realized returns, especially in commodities where term structure can shift. Fees also distort comparisons: a strategy that earns 6% gross but charges 2% total fees and suffers a 10% drawdown can look very different from a strategy that earns 5% gross with lower friction.
Supporting technologies and dependencies shape outcomes. Most managed futures programs rely on systematic signal generation, risk targeting, and portfolio construction across futures curves. Risk targeting often uses volatility estimates and can reduce exposure after losses, which changes the path of returns even if long-run performance remains similar. Execution quality and slippage assumptions matter more during high volatility, when bid-ask spreads widen and market impact grows. A manager that uses daily signals with end-of-day pricing can behave differently than one that uses intraday data, and the difference rarely shows up in glossy performance charts.
Correlation behavior is also misunderstood. “Crisis alpha” is often described as low correlation to equities during drawdowns, but correlation is conditional and time-varying. A strategy can have low correlation during one crisis and higher correlation during another if both are driven by the same macro factor, such as a broad liquidity squeeze. This is why investors should look at rolling correlations and drawdown timing, not only headline correlation numbers.
How To Evaluate Managed Futures
Separate Regimes With Evidence
Start by defining crisis and normal periods using transparent rules rather than manager-selected dates. A practical approach is to use multiple stress windows (for example, a 2008-like deleveraging period, a 2020-like liquidity shock, and a 2022-like inflation/interest-rate shock) and compare performance across all of them. If the manager cannot explain how the crisis window was chosen, treat “crisis alpha” as a marketing label. When you review monthly returns, look for whether gains cluster during drawdowns or whether they occur after markets recover, which can happen when signals lag.
For a quick sanity check, compute drawdown depth and recovery time for both crisis and non-crisis windows. A strategy that posts small positive returns during stress but takes long to recover from prior drawdowns may still fail the investor’s risk objective. I often see investors focus on peak-to-trough drawdown but ignore time-to-recovery, which can be the difference between “helpful diversification” and “capital tied up when you need it.”
Model Fees, Leverage, And Friction
Managed futures performance should be compared net of fees, not gross. Ask for the fee schedule and how it applies to performance and assets under management. Many programs charge management fees plus incentive fees, and incentive fees can be based on high-water marks that change realized outcomes. Also request details on leverage limits and risk targeting methodology, because exposure can scale down after volatility rises.
Execution and contract roll assumptions matter too. If the manager uses a specific data vendor or execution system, request the general approach and whether it includes slippage estimates. A minor detail like “version 3.2 of the risk model” (a phrase I have seen in due diligence materials dated 2021-10) can signal that the model changed, which affects comparability across time. If the manager cannot provide change logs, you are left guessing whether backtests reflect current trading behavior.
Check Risk Metrics Beyond Alpha
Use a small set of risk metrics that map to investor constraints. Look at maximum drawdown, downside deviation, and worst monthly return, then compare those across crisis and normal windows. Track whether the strategy’s volatility targeting reduces exposure during stress or whether it increases exposure when volatility spikes. Trend-following systems often reduce exposure after losses, which can protect capital but also cap upside during sharp recoveries.
Also examine concentration across asset classes. A “crisis alpha” story built mostly on one market segment can fail when that segment behaves differently. For example, if performance relies heavily on equity index futures trends, a crisis driven by commodities or FX may not produce the same signal persistence. Ask for attribution by asset class and by signal type, even if the manager provides it only at a high level.
Stress-Test With Scenario Logic
Instead of relying on one crisis, run scenario-based checks using historical analogs. For instance, compare how the strategy performed during sustained equity selloffs versus rapid mean-reverting selloffs. Trend-following tends to struggle when markets whip around without sustained direction, because signals flip and risk targeting can reduce exposure after repeated losses.
When you review a manager’s claims, request information about how the system handles regime changes such as volatility spikes, changes in interest-rate curves, and shifts in commodity term structure. A manager that uses volatility scaling may respond quickly to volatility, but that scaling can also reduce position size right when trend persistence is strongest. This is the kind of trade-off that shows up in return paths rather than in a single “alpha” number.
Educational Case Examples
Scenario A: Crisis Outperformance, Weak Normal Returns. An investor reviews a managed futures fund that shows strong performance during a 2020-like liquidity shock window, with positive returns in most months of equity drawdown. Outside that window, the fund’s returns are modest and sometimes negative during extended sideways markets. The due diligence reveals that the strategy’s trend signals require sustained directional movement, and the risk targeting reduces exposure after repeated signal reversals. The investor decides the fund fits a “crisis ballast” role, but only if the portfolio already has growth assets and can tolerate lower normal-period returns.
Scenario B: Smooth Normal Returns, Mixed Crisis Behavior. Another investor evaluates a fund with steady positive returns during normal periods and relatively low drawdowns. During a rate-shock period, the fund’s performance is flat or slightly negative while equities fall sharply. The manager explains that the strategy’s dominant signals were calibrated to equity and credit futures trends, while the crisis was driven by a rapid shift in the rates curve and FX volatility. The investor does not reject the strategy automatically; instead, they pair it with another diversifier and adjust expectations about when the trend signals will activate.
Comparison Checklist For Due Diligence
| Item To Compare | Crisis Alpha Focus | Normal-Market Focus | What To Ask |
|---|---|---|---|
| Crisis Definition | Transparent windows, multiple episodes | Clear normal regime rules | How were dates selected and why? |
| Return Path | Gains during drawdowns, not after | Consistent months, fewer whipsaws | Show monthly returns by regime |
| Drawdown Behavior | Shallow drawdowns, fast recovery | Lower worst-month losses | Max DD and time-to-recovery |
| Risk Targeting | Exposure scales down or up in stress | Stable volatility control | Method for volatility estimates |
| Fees And Incentives | Net performance after high-water marks | Net performance across full cycle | Fee schedule and net returns |
Step-by-step checklist:
- Request audited or independently verified track record data and confirm whether it is net of fees.
- Ask for monthly returns and compute crisis vs normal performance using your own date rules.
- Compare drawdown depth and time-to-recovery for each regime.
- Review asset-class exposure and attribution so crisis performance is not a single-market accident.
- Confirm risk targeting and leverage limits, then check how exposure changes during volatility spikes.
- Review execution and roll methodology at a high level, including slippage assumptions.
- Document model changes and stop using backtest-only narratives when live behavior differs.
Common Mistakes That Break Trust
One frequent issue is cherry-picking. A manager may show crisis returns from a narrow window that coincides with favorable trend persistence, while the longer history shows more mixed outcomes. Another issue is mixing strategy and fund share classes without adjusting for fee differences and timing of subscriptions and redemptions.
Investors also over-trust “alpha” labels without checking the benchmark and the measurement method. If the benchmark is chosen to make the strategy look diversifying, the conclusion can be misleading. A trend strategy can look uncorrelated to equities while still being exposed to the same macro drivers through rates, volatility, or liquidity.
Finally, many due diligence processes ignore operational details that affect realized returns. Managed futures funds can have different valuation conventions, trading cutoffs, and liquidity terms. A fund that prices daily but executes with delayed settlement can produce return artifacts around stress events, and those artifacts can be mistaken for genuine signal performance. When you see performance charts that do not match the monthly return series, ask for the reconciliation.
FAQ
What Is “Crisis Alpha” In Managed Futures?
It usually refers to returns during market stress periods that are higher than what you would expect from normal behavior. The term is not standardized, so you should verify the crisis window definition and whether the returns are net of fees.
Do Managed Futures Always Perform In Bear Markets?
No. Trend-following strategies tend to benefit from sustained directional moves, but they can underperform during sharp reversals and range-bound volatility where signals flip repeatedly.
How Should I Compare Crisis vs Normal Returns?
Use monthly returns and apply your own regime windows, then compare drawdown depth, time-to-recovery, and worst-month losses across those windows rather than relying on a single headline number.
What Role Do Fees Play In Net Performance?
Fees and incentive structures can materially change outcomes, especially when returns are volatile. You should compare net returns after high-water marks and confirm whether the track record is net of all fees.
What Risk Factors Should I Ask About?
Ask about volatility targeting, leverage limits, asset-class concentration, and how the strategy handles futures roll and slippage assumptions during high volatility.
Author's Insight
Managed futures performance depends on regime behavior: trend signals work best when price moves persist, and they struggle when markets mean-revert quickly. “Crisis alpha” claims become credible only when the crisis definition is transparent, the returns are net of fees, and the return path shows gains during drawdowns rather than after recovery. Risk targeting and leverage limits often explain why a strategy can look defensive in stress yet still deliver modest normal-period returns. A careful comparison uses monthly data, drawdown timing, and exposure attribution across asset classes, not only correlation headlines.
Key Takeaways
- Crisis alpha and normal-market returns can diverge because trend signals respond differently across volatility and persistence regimes.
- Evaluate using your own crisis and normal windows, then compare drawdown depth and time-to-recovery.
- Net performance matters: fees, incentive structures, and risk targeting can change outcomes more than small differences in reported “alpha.”
- Check exposure attribution and risk targeting mechanics so crisis performance is not tied to one accidental market segment.
- Demand clarity on model changes, execution assumptions, and roll methodology to avoid backtest-to-live mismatches.