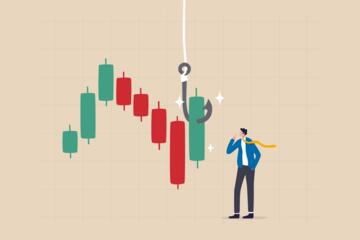
Bear Markets And Strategy Choice
Bear markets test how a strategy reacts to falling prices, not just how it performs in calm periods. Buy-and-hold aims to ride out declines by holding a diversified portfolio through volatility. Trend following aims to reduce exposure when price action suggests a downtrend, then re-enter when conditions improve. The two approaches differ in timing, risk profile, and the kind of information they respond to: long-run fundamentals versus shorter-run market direction.
In practice, “bear market” can mean different things: a broad index down 20% to 30%, a prolonged sideways-to-down regime, or a sharp drawdown followed by a fast rebound. Those differences matter because trend signals depend on recent price history, while buy-and-hold depends on what you do during the decline. A portfolio that drops 35% and takes five years to recover behaves differently from one that drops 35% and recovers in six months.
For readers building a plan, the key question is not which approach sounds better, but which failure mode you can tolerate. Trend following can miss reversals and whipsaw, while buy-and-hold can lock in multi-year drawdowns. The decision becomes a trade between staying invested and changing exposure based on observed trends.
Common Pain Points And Misreads
Many investors treat “trend following” as a single method, then judge it by one backtest or one market cycle. Trend systems vary widely: some use moving averages, others use channel breakouts, and others use volatility scaling. Two trend strategies can both “follow trends” yet behave very differently when volatility spikes or when markets chop sideways.
Buy-and-hold is also easy to misread. People often assume that long-term returns automatically smooth bear markets, but the path matters for cash-flow needs and behavioral discipline. If you need withdrawals during a drawdown, a buy-and-hold plan can force sales at depressed prices. Even without withdrawals, a portfolio’s recovery time can exceed an investor’s planned horizon.
Both approaches depend on supporting technologies that are easy to overlook. Trend following depends on data quality (adjusted prices, corporate actions, survivorship bias in backtests) and on execution rules (rebalancing frequency, transaction costs, slippage). Buy-and-hold depends on rebalancing policy, tax treatment, and how you handle concentration risk. A strategy that ignores trading costs can look good in a spreadsheet and fail in a brokerage account.
There is also a dependency on how you define exposure. Trend following may move to cash, short positions, or hedges, each with different mechanics and risks. Shorting introduces borrow costs and margin constraints; hedging introduces basis risk and roll costs. Cash reduces market exposure but can create opportunity cost and reinvestment timing issues.
Solutions And Practical Advice
Choose A Trend Signal With Rules
Pick a trend rule you can describe in one sentence and test with realistic assumptions. A common starting point is a moving-average crossover or a moving-average slope filter, but you must specify the lookback window and the re-entry logic. For example, a 200-day moving average filter reacts slowly; a 50-day filter reacts faster but can whipsaw in range-bound markets. In a personal aside from building models, I’ve seen people copy a “50/200” rule from a forum and forget to adjust for trading days versus calendar days, which changes signal timing.
Use volatility-aware position sizing if your system scales exposure. Without scaling, a trend strategy can concentrate risk during high-volatility drawdowns. When you backtest, include estimated transaction costs and a conservative slippage assumption; even 10–50 basis points per trade can matter if you trade frequently. If you use a platform like TradingView, versioned scripts (for example, Pine Script v5) help you track rule changes, because small edits can alter performance materially.
Track out-of-sample results. A trend system that performs well only in the same period used to tune parameters may not generalize. If you cannot explain how you would validate the rule before using real money, the rule is still a hypothesis.
Set A Buy-And-Hold Rebalancing Plan
Buy-and-hold works best when “hold” includes a disciplined rebalancing policy. Without rebalancing, an asset that falls less can become a larger share, and the portfolio’s risk profile drifts. A simple approach is to rebalance on a schedule (for example, quarterly) or when allocations deviate by a threshold (for example, 5% absolute drift). The exact numbers depend on your tax situation and transaction costs.
Define withdrawal rules if you need liquidity. A common risk-control method is to separate near-term spending from long-term growth assets, so you do not sell equities during the worst months. If you use a bucket approach, you still need to decide how you refill buckets after rebounds, which is where many plans get messy.
Tax-aware rebalancing matters. In taxable accounts, selling to rebalance can trigger capital gains. In retirement accounts, the tax drag is different, so the same rebalancing schedule can produce different net outcomes.
Stress Test Both Strategies Under Drawdowns
Run scenario tests that reflect how bear markets actually unfold: gradual declines, sharp sell-offs, and choppy recoveries. Trend following often struggles in sideways markets where signals flip repeatedly, so include a “range-bound” scenario in your evaluation. Buy-and-hold often struggles when the recovery takes longer than your planned horizon or when withdrawals occur during the decline.
Measure more than final return. Track maximum drawdown, time-to-recovery, and worst 12-month return. For trend systems, also track turnover and the number of signal flips per year, because high turnover increases costs and can create tax events in taxable accounts. On a spreadsheet I used in March 2023, two strategies with similar CAGR had very different drawdown durations because one re-entered too early after partial recoveries.
Decide in advance what would cause you to stop or reduce risk. A rule-based system still needs a human decision layer when markets behave outside the assumptions used in testing.
Use Risk Controls Instead Of Predictions
Both strategies can be paired with risk controls that do not require forecasting. For trend following, you can cap exposure, require a minimum trend strength, or limit leverage. For buy-and-hold, you can cap equity allocation, diversify across asset classes, and maintain a cash or bond sleeve for near-term needs.
Be cautious with leverage. Leveraged trend strategies can amplify whipsaws and margin calls during volatility spikes. If you use derivatives, confirm how they roll and how collateral is handled; these mechanics can dominate outcomes in stressed markets.
Document your decision process. A written plan reduces the chance that you abandon a strategy at the worst time, which is when behavior tends to override rules.
Case Examples For Learning
Example 1: Choppy Decline With Whipsaws
An anonymized investor holds a diversified equity ETF portfolio and also runs a simple trend filter on a broad market index. During a bear phase that alternates down days and up days, the trend rule flips exposure multiple times over six months. The investor notices that transaction costs and slippage reduce returns, and the system misses a portion of the early rebound because re-entry requires the trend filter to confirm. The investor adjusts by increasing the lookback window and adding a volatility scaling step, which reduces turnover but delays re-entry.
This scenario illustrates a common pattern: trend following can reduce exposure during sustained downtrends, yet it can underperform when the market chops. The lesson is not that trend following fails, but that the signal design and cost assumptions determine whether it helps or harms.
Example 2: Long Drawdown And Withdrawal Timing
An anonymized household plans to withdraw from a portfolio for living expenses. They use buy-and-hold for long-term growth assets but keep a separate short-term allocation in high-quality bonds. In a prolonged bear market, equities decline sharply, yet the household draws from the bond sleeve rather than selling equities. When equities recover, they rebalance to restore the original allocation. The household’s outcome depends less on the equity recovery speed and more on whether the bond sleeve lasts through the drawdown period.
This scenario shows why buy-and-hold performance cannot be judged only by long-run averages. Withdrawal timing and liquidity planning can dominate the lived experience of a bear market.
Comparison Table And Checklist
| Decision Factor | Trend Following | Buy-and-Hold | What To Check |
|---|---|---|---|
| Primary Goal | Reduce exposure during downtrends | Stay invested through volatility | Your acceptable drawdown and time horizon |
| Common Failure Mode | Whipsaw in sideways markets | Long recovery or forced selling | Worst 12-month return and time-to-recovery |
| Trading Costs | Higher turnover possible | Lower turnover if rebalanced rarely | Assume realistic costs, not zero |
| Tax Sensitivity | Sales can trigger capital gains | Fewer taxable events if held | Account type and rebalancing triggers |
| Data And Backtest Risk | Parameter tuning can overfit | Concentration drift if not rebalanced | Out-of-sample checks and cost assumptions |
Checklist for decision support:
- Write down your time horizon and whether you need withdrawals during a drawdown.
- For trend following, specify the signal, lookback window, re-entry rule, and position sizing method.
- For buy-and-hold, specify rebalancing frequency or drift thresholds and tax-aware rules.
- Backtest with realistic transaction costs and slippage; record turnover and drawdown duration.
- Stress test at least three regimes: steady decline, sharp drop, and choppy range.
- Decide what you will do if the strategy underperforms for a full year, because bear markets rarely end on schedule.
Common Mistakes That Erode Trust
One mistake is judging trend following by a single metric like CAGR while ignoring drawdown duration. A strategy that reduces peak-to-trough losses can still fail if it takes too long to recover for your needs. Another mistake is using “adjusted close” data without checking corporate action handling, which can distort signals around splits and dividends.
Investors also confuse “going to cash” with “eliminating risk.” Cash still carries inflation risk, and the timing of moving in and out can create opportunity cost. If a trend system keeps you out during the early rebound, the portfolio can underperform even if it avoided some losses.
Buy-and-hold mistakes often involve concentration and drift. Holding a single sector or a narrow set of stocks can turn a “diversified” plan into a fragile one. Another mistake is rebalancing too aggressively in taxable accounts, which can create avoidable capital gains during volatile periods.
Promotional writing tends to hide assumptions. If a strategy claims consistent bear-market outperformance, ask what costs were assumed, how often trades occurred, and whether the results were tested out of sample. When those details are missing, the claim becomes hard to verify.
FAQ
Does Trend Following Always Beat Buy-And-Hold?
No. Trend following can underperform during sideways markets because signals can flip repeatedly, and costs can erode returns. Buy-and-hold can outperform when recoveries start quickly and investors stay invested.
What Data Is Used For Trend Signals?
Most trend systems use historical price series such as adjusted closes, sometimes with volatility measures derived from returns. The exact choice of lookback window and whether prices are adjusted for corporate actions changes signal timing.
How Do Transaction Costs Affect Trend Systems?
Turnover drives cost impact. If a strategy trades frequently, even modest commissions and slippage assumptions can materially change net performance versus backtests that assume frictionless trading.
Can Buy-And-Hold Reduce Bear-Market Damage?
It can, mainly through diversification, rebalancing, and liquidity planning for withdrawals. A separate short-term bond or cash sleeve can reduce forced selling during drawdowns.
Is A Hybrid Approach Common?
Some investors combine elements, such as holding a core long-term allocation while using trend rules for a tactical sleeve. The key is to define how the sleeves interact, how rebalancing works, and how taxes apply.
Author's Insight
Trend following and buy-and-hold differ in the timing of risk reduction. Trend systems respond to recent price behavior, so their performance depends on signal design, turnover, and cost assumptions; buy-and-hold depends on staying invested and managing withdrawal needs and allocation drift. Evidence from many backtests suggests both approaches can work in certain regimes, yet neither guarantees better outcomes across all bear markets. A careful evaluation focuses on drawdown duration, time-to-recovery, and how the plan behaves when markets chop rather than trend.
Key Takeaways
- Trend following changes exposure based on rules tied to recent price history, which can help in sustained downtrends and hurt in sideways markets.
- Buy-and-hold relies on discipline through volatility, so withdrawal timing and rebalancing policy often matter more than average returns.
- Backtests must include realistic transaction costs, slippage, and out-of-sample validation to avoid overfitting.
- Choose the strategy whose failure mode you can tolerate, then document what you will do during a full year of underperformance.