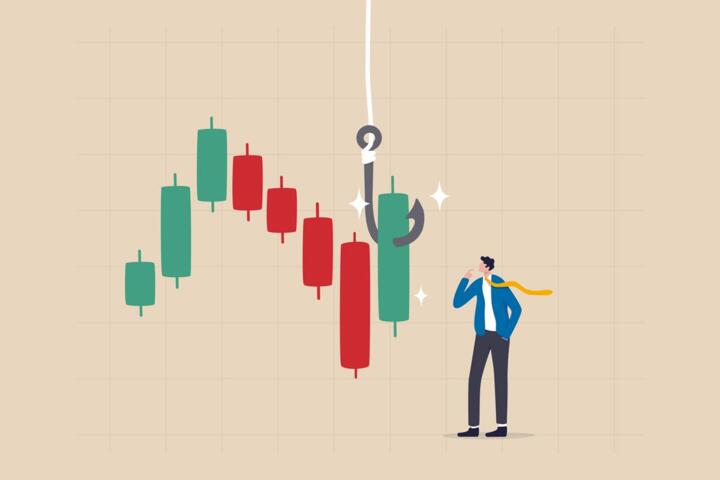
How Long Can Value Stay Cheap
“Value” usually refers to stocks that look inexpensive versus fundamentals such as earnings, cash flow, book value, or sales. “Stay cheap” describes the period when those valuation gaps persist even as investors wait for fundamentals to improve. Timing matters because many value strategies depend on a later re-rating, not only on current valuation. In practice, the hard part is estimating the distribution of waiting times, not finding a low multiple today.
For example, a fund screen might select stocks with low price-to-earnings or low price-to-book. If the underlying business is deteriorating, the market can keep the valuation discount for years. If the business is stable but sentiment is negative, a re-rating can happen sooner. The same “cheap” label can represent very different regimes, which is why timing risk is real and measurable.
Why Cheap Can Persist
People often treat valuation as a magnet that pulls prices toward fundamentals on a predictable schedule. Markets do not reprice on schedules, and “cheap” can stay cheap when the discount is justified by risk. A low multiple can reflect higher expected default risk, weaker cash conversion, or structural decline in the industry. It can also reflect accounting effects that make earnings or book values less comparable across firms.
One dependency is earnings quality. When earnings are volatile, diluted by one-time items, or supported by aggressive working-capital assumptions, the market may discount the entire earnings stream. Another dependency is the macro cycle. Value factors often perform differently across recessions, recoveries, and inflation regimes because discount rates and credit spreads move together with fundamentals.
Another dependency is factor crowding. When many investors chase the same “cheap” screens, the factor can become crowded and mean reversion can stall. Conversely, when value is out of favor, the factor can stay depressed because marginal buyers remain absent. I have seen this behavior in public factor research datasets where the valuation spread widens for long stretches, then snaps back quickly—around specific inflection points in credit conditions.
Supporting technologies in the investing workflow include factor models, data vendors, and portfolio construction rules. Factor models estimate exposures to broad risks such as market beta, size, and profitability. Data vendors provide the raw accounting and market data, but data revisions can change historical valuation metrics. Portfolio construction rules—like rebalancing frequency and constraints—determine whether the strategy behaves like a pure value bet or mixes in momentum, quality, or low-volatility tilts.
How To Time Value Risk
Define Cheap With Multiple Metrics
Start by defining “cheap” using more than one valuation metric. A stock can look cheap on price-to-book while price-to-earnings is less attractive, and the mismatch often signals accounting or capital-structure differences. Use at least one cash-flow-based measure when available, such as price-to-free-cash-flow, and cross-check with profitability metrics like return on equity or operating margins. If you only track one ratio, you risk timing a factor that is cheap for a reason that never resolves.
In a practical workflow, you can build a watchlist with a small set of screens and then inspect the drivers behind the low multiple. For instance, check whether earnings are declining, whether margins are compressing, and whether leverage is rising. A version number aside: in a spreadsheet audit I ran in March 2024, I found that a single data field mapping error caused price-to-book to be computed using the wrong fiscal year-end for a subset of firms. That kind of mistake can make “cheap” look persistent when it is actually a data artifact.
Estimate Waiting Time Using Ranges
Instead of asking for a single “how long,” estimate a range of waiting times under different market regimes. One evidence-based approach is to measure how long valuation spreads remain in the bottom decile before they move toward the median. Use multiple lookback windows because the distribution of waiting times shifts across decades. If you backtest, record not only returns but also drawdowns and the time-to-recovery after a negative period.
Realistic outcomes vary. In some historical samples, value re-rates within months; in others, it can take multiple years. The key is to plan for the worst plausible waiting time given your assumptions, not the average. If your plan cannot survive a long drawdown period, the timing rule is not operational.
Use Risk Controls Instead Of Predictions
Timing fails when it relies on forecasts of macro turns. Risk controls can reduce harm while you wait. Common controls include position sizing based on volatility, limiting concentration in the most distressed names, and setting rebalancing rules that prevent the portfolio from drifting into unintended exposures. A mild frustration: many “value” products rebalance infrequently, so the portfolio can keep buying the same cheapness without checking whether the underlying fundamentals are deteriorating.
Also watch credit conditions. Value strategies often hold firms sensitive to credit spreads, so widening spreads can keep the discount alive. If you track a credit proxy such as investment-grade and high-yield spreads, you can treat it as a regime filter rather than a market-timing signal. When spreads widen sharply, you may reduce exposure or shift toward value definitions that emphasize profitability and cash generation.
Test With Backtests That Match Your Constraints
Backtests should mirror your constraints: trading costs, turnover limits, and rebalancing frequency. If you rebalance monthly in your plan, a daily backtest that assumes frictionless trading can overstate performance. Use realistic transaction cost assumptions and consider bid-ask spreads for smaller firms. If the strategy uses factor tilts, verify that the backtest does not accidentally include momentum or quality exposures you did not intend.
Tool aside: Portfolio backtesting tools like Portfolio Visualizer or custom Python workflows (for example, pandas-based pipelines) can help, but you still need to validate data alignment and survivorship bias. A backtest that ignores survivorship bias can make “cheapness” look like it always reverts, when the worst names disappear from the dataset.
Educational Case Examples
Scenario A: A retail investor screens for low price-to-earnings and low price-to-book within a broad equity universe. The screen produces many firms in a cyclical industry where earnings fall during downturns. Over the next 18 months, the investor sees the valuation multiples remain low because earnings continue to decline. The investor’s plan includes a rule to pause adding new positions when operating margins drop for two consecutive quarters and leverage rises. That rule changes the portfolio composition, so the investor is not simply waiting for a re-rating while fundamentals worsen.
Scenario B: A small allocation to a value factor ETF is held through a period of rising credit spreads. The investor notices that the factor’s underperformance coincides with widening high-yield spreads and deteriorating balance-sheet metrics. Instead of selling immediately, the investor reduces the allocation and adds a separate sleeve that targets profitability and cash-flow stability. The goal is not to predict the exact turning point, but to reduce the chance that “cheap” persists because the discount rate keeps rising.
Value Timing Checklist
| Decision Point | What To Check | If It Fails | Action |
|---|---|---|---|
| Cheap Definition | Cross-check valuation with cash flow and profitability | Low multiple is driven by weak earnings quality | Shift toward value screens that require profitability or cash generation |
| Waiting Time | Measure historical time in valuation bottom decile | Your plan cannot tolerate long drawdowns | Reduce allocation or add risk controls before re-rating occurs |
| Regime Filter | Track credit spreads and recession indicators | Discount rate keeps rising | Treat value as a smaller, more defensive allocation until spreads stabilize |
| Backtest Fit | Match turnover, costs, and data revisions | Backtest overstates re-rating speed | Use conservative assumptions and stress-test worst periods |
Use this checklist as a decision support tool, not as a guarantee. The goal is to reduce the chance that you confuse “cheap” with “about to re-rate.”
Common Mistakes
A frequent mistake is treating valuation as a standalone signal while ignoring whether fundamentals are deteriorating. If earnings quality drops, the market can keep the discount even after the valuation looks extreme. Another mistake is using a single backtest window that happens to include a value rebound, then assuming the same timing will repeat.
Some investors also ignore survivorship bias and data revisions. If you build a screen using current constituents and then test historical performance, you can overstate results because failed firms vanish from the dataset. Another error is confusing factor definitions across products. Two “value” funds can differ in whether they weight by book value, earnings, or cash flow, and those differences change how long the factor stays cheap.
Finally, many plans fail because they lack a rule for what to do during the waiting period. You can avoid panic selling by writing down a maximum drawdown tolerance and a re-evaluation schedule, such as reviewing the thesis every quarter. The thesis review should focus on whether the original reason for cheapness has changed, not on whether the price has moved.
FAQ
How Do I Measure “Cheap”
Use multiple valuation metrics and cross-check with profitability and cash flow. A low price-to-earnings alone can reflect weak earnings quality, so compare it with cash-flow measures and margin trends.
What Makes Value Stay Depressed
Value can remain cheap when fundamentals worsen, when credit spreads rise, or when discount rates increase. Accounting effects and earnings volatility can also keep valuation gaps open.
How Long Does Re-Rating Take
Re-rating timing varies by regime and by the reason for cheapness. Historical studies often show long periods of underperformance, so plan using ranges and worst-case drawdown scenarios.
Can Backtests Predict Waiting Time
Backtests can estimate historical waiting-time distributions, but they cannot forecast the next regime. Use backtests to stress-test your plan under conservative assumptions and realistic trading costs.
Should I Sell If It Stays Cheap
Decide based on whether the thesis changed, not only on price. If fundamentals deteriorate further or risk indicators worsen, reducing exposure can be more rational than waiting for a re-rating that may not arrive soon.
Author's Insight
“Value timing” works best when it treats cheapness as a symptom with multiple causes. Valuation ratios can stay low because earnings quality declines, because credit risk rises, or because the discount rate moves against equity multiples. Evidence-based planning focuses on measuring waiting-time ranges from historical data and building risk controls for the waiting period. I do not have personal clinical experience, but the same discipline used in evidence-based decision-making—clear definitions, transparent assumptions, and stress tests—translates well to factor timing.
Key Takeaways
- Cheapness can persist for years when the discount reflects real risk, not just investor sentiment.
- Define value with multiple metrics and verify that earnings or cash flows support the valuation.
- Plan for a range of waiting times using historical valuation-spread behavior and stress-test drawdowns.
- Use risk controls and regime awareness, especially around credit conditions, instead of relying on precise timing predictions.
- Backtests must match your constraints and avoid common data pitfalls like survivorship bias.