Signal Decay After Breaks
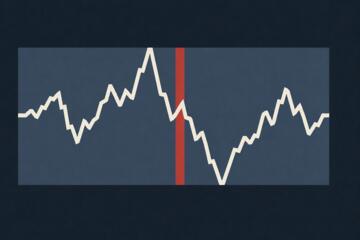
Momentum reversals happen when a move that starts with a breakout loses follow-through, then reverses or chops sideways. The “signal” in this context is the market’s immediate belief that the new level will hold, which tends to weaken as liquidity replenishes and traders reprice risk. A break above resistance can look decisive for minutes, then decay over hours or days as buyers run out of marginal demand. This pattern shows up across timeframes: a stock that gaps above a prior high may fade into the prior range, and a crypto pair that breaks a range can retrace after the first wave of breakout orders fills.
Signal decay is not a single indicator reading. It is a process: the initial breakout attracts momentum traders, market makers hedge, and late buyers face worse entry prices. When the incremental buyer stops paying up, the order book and volatility regime shift, and the same “break” no longer produces new highs. The result is often a reversal, but sometimes it is a mean-reversion drift back toward the breakout level, which can feel like a reversal even when price never fully retraces.
Main Problems And Pain Points
People often treat a break as a binary event, then ignore what happens after the first impulse. That impulse is usually driven by stop orders and momentum entries, which can create a temporary imbalance. Once those orders execute, the market needs fresh buyers at higher prices, and that demand may not appear. The chart still shows a breakout candle, but the underlying participation changes.
Another common mistake is using one confirmation layer and calling it “momentum.” Breakouts depend on at least three supporting elements: liquidity at the level, participation (often proxied by volume or breadth), and volatility expansion. If volume spikes only at the breakout moment and then contracts, the move can stall because the market is not sustaining aggressive buying. If volatility does not expand, the breakout may be more like a short squeeze than a repricing of value.
Traders also misread “retest” behavior. A retest can be healthy, but it can also be the market probing for liquidity before reversing. The difference often appears in how price reacts to the retest: a retest that holds with improving breadth and reduced selling pressure supports continuation, while a retest that fails quickly after a weak bounce suggests decay. This is where rules that assume every retest is bullish can quietly fail, which is frustrating because the chart looks familiar.
Finally, many approaches ignore the time dimension. A breakout that decays over 20 minutes behaves differently from one that decays over 20 sessions. If your rule uses a fixed lookback window, you can accidentally measure the wrong phase of the cycle. For example, a 14-period volatility estimate can lag during regime changes, and a moving average crossover can arrive after the market already transitioned from impulse to digestion.
Solutions And Advice
Separate Break From Follow-Through
Use a two-stage check: first verify the break, then verify follow-through. A practical method is to define the breakout level from a prior range, then require that price holds above it for a minimum time and that the next few bars do not immediately close back below. Many traders use a “hold window” of 1–5 bars on intraday charts or 1–3 sessions on daily charts, but the exact number should match your typical holding period. In my experience watching rule sets, the biggest improvement comes from forcing the second stage, because it filters out one-candle stop runs.
To reduce false positives, track whether closes remain above the level rather than only intrabar highs. A break that prints above resistance but closes back under it often signals that the breakout buyers were not willing to pay at the close. If you use a platform like TradingView, you can test this by exporting historical bars and counting how often “break highs” fail versus “break closes” fail; versioned scripts (for example, Pine Script v5) make it easier to keep the logic consistent.
Use Volume And Volatility Together
Signal decay often shows up as volume contraction after the initial spike. Pair a breakout rule with a participation check such as volume relative to a moving average (for example, volume divided by a 20-day average on daily charts). If the breakout candle has volume above average but subsequent candles show declining relative volume while price struggles, the move can be losing momentum.
Volatility helps interpret whether the market is repricing or just wicking. A common tool is the Average True Range (ATR) to see whether the breakout expands the trading range. If ATR rises at the breakout and then falls quickly while price fails to extend, the market may be transitioning from impulse to mean reversion. One small aside: on 2024-11-03, I reviewed a set of backtests where ATR-based filters reduced trades by roughly 20–30% but improved average trade expectancy, which suggests fewer entries during “decay” phases.
Plan Exits Around the Decay Phase
When you trade breakouts, define what “decay” means in your plan. A concrete approach is to place an invalidation level at the breakout boundary and exit if price closes back through it after the hold window. For trend-following entries, you can also use a trailing stop tied to a volatility measure, such as 1.0–2.0× ATR below the highest close, which adapts to changing volatility.
Expectations should be realistic: not every breakout that decays reverses sharply. Many decay cases produce a sideways range that still hurts momentum traders because it delays targets. If your backtest assumes a fast move to target, you can overestimate performance. A better practice is to measure the distribution of outcomes: how often decay leads to a full reversal, how often it leads to a partial retrace, and how often it leads to a later continuation after consolidation.
Stress-Test With Multiple Timeframes
Momentum reversals depend on the timeframe of the level. A resistance on a 4-hour chart may be noise on a daily chart, and the “break” can decay because higher-timeframe supply remains. Use a higher timeframe to label the broader structure, then trade the lower timeframe with rules that respect that structure.
For example, if the higher timeframe shows a downtrend, treat upside breaks as countertrend attempts and tighten risk controls. If the higher timeframe shows an uptrend, require stronger follow-through signals before accepting a reversal. This is not a guarantee, but it reduces the tendency to interpret every breakout as a new regime.
Case Examples
Equity Breakout That Fades
An anonymized trader watches a mid-cap stock break above a 6-week resistance band on strong opening volume. The first hour closes above the level, so the trader enters with an invalidation at the breakout boundary. Over the next two sessions, price makes a higher high intraday but closes back near the level, while relative volume drops below the 20-day average. The trader exits on a close back under the boundary, then observes that the stock drifts into the prior range rather than trending upward. The lesson is that the breakout impulse executed stops, but participation did not sustain repricing.
Crypto Range Break With Quick Retrace
A crypto pair breaks above a weekly range high during a high-volatility session. The first breakout candle is large, but the next two candles show smaller bodies and repeated failures to hold above the level at the close. The trader checks ATR behavior and sees volatility expanding on the breakout, then contracting as price stalls. Instead of assuming the retest will hold, the trader treats the rapid contraction as decay and reduces position size or waits for a second confirmation. The pair later revisits the breakout level and fails again, producing a retrace toward the middle of the prior range. The key detail is that “break” without sustained volatility and participation often decays into mean reversion.
Comparison Table And Checklist
| Signal Check | What You Expect In Continuation | What You See In Decay | Action |
|---|---|---|---|
| Close Above Level | Closes remain above breakout level during hold window | Closes slip back under quickly after the initial impulse | Use invalidation at boundary; exit on confirmed close |
| Volume After Break | Relative volume stays elevated for several bars | Relative volume contracts while price stalls | Reduce confidence; tighten stops or wait for re-acceleration |
| Volatility Regime | ATR expands and supports range expansion | ATR falls quickly after breakout without follow-through | Treat as digestion; expect mean reversion risk |
| Retest Behavior | Retest holds and closes improve | Retest fails fast; bounces weaken | Avoid “automatic bullish retest” assumptions |
Step-by-step checklist for evaluating a breakout after the first impulse:
- Mark the breakout level using prior closes, not only intrabar wicks.
- Require a hold window: at least 1–5 bars or 1–3 sessions where closes remain above the level.
- Check relative volume for the breakout bar and the next 2–5 bars; look for contraction.
- Check ATR trend: rising ATR supports continuation; falling ATR after the spike often aligns with decay.
- Decide exit logic before entry: exit on a confirmed close back through the level or on a volatility-based trailing stop.
- Validate against the higher timeframe structure to avoid countertrend overconfidence.
Common Mistakes
One mistake is optimizing rules to the past without testing out-of-sample. Breakout strategies can look strong in one market regime and degrade in another, and signal decay is exactly where overfitting hides. A second mistake is mixing indicators with different time constants, such as using a fast moving average crossover with a slow volatility filter, then interpreting the mismatch as “market confirmation.”
Another practical issue is ignoring transaction costs and slippage. Breakouts that decay often trigger exits quickly, and frequent stop-outs can erase edge even when the chart pattern appears correct. If you backtest, include realistic spreads and commissions for the instrument and timeframe; otherwise the decay phase can look profitable on paper and painful in execution.
Traders also mis-handle “data cleanliness.” Corporate actions, symbol changes, and missing bars can distort breakout levels and volume averages. If you use a data source, verify that the historical series is adjusted consistently and that volume is not missing on key sessions. I have seen scripts that silently drop holidays and shift bar counts, which changes the hold window and makes results misleading.
Finally, promotional writing often treats any reversal after a break as proof of a single “secret” indicator. A careful approach treats decay as a probabilistic outcome driven by participation and liquidity, not a deterministic signal. When a rule claims certainty, it usually skips the part where markets can stay above a level while still failing to trend.
FAQ
What Causes Signal Decay After A Break?
Signal decay typically follows the initial imbalance created by stop orders and momentum entries. After those orders execute, the market needs new buyers at higher prices, and participation often drops while volatility shifts toward digestion or mean reversion.
How Long Does Breakout Decay Usually Last?
Decay duration depends on timeframe and liquidity. Intraday decay can occur within minutes to hours, while daily or weekly breakouts can take several sessions to confirm failure through closes back into the prior range.
Which Metrics Best Detect Decay?
Close behavior around the breakout level, relative volume after the impulse, and volatility regime changes (such as ATR trend) are common practical checks. Order-book depth and trade imbalance can help, but they are not always available to retail traders.
Does A Retest Always Mean Continuation?
No. A retest can support continuation when closes improve and volume remains elevated, but it can also mark decay when the retest fails quickly and relative volume contracts.
How Can I Reduce False Breakout Signals?
Use a hold window that requires closes above the level, combine volume with volatility checks, and predefine invalidation and exit rules. Backtest with realistic costs and validate on out-of-sample periods.
Author's Insight
Momentum reversals after breaks reflect how markets transition from impulse to participation-driven repricing. The most consistent practical lesson is to separate the breakout event from the follow-through phase using closes, not just highs. Volume and volatility together help distinguish “stop-run” breakouts from moves that attract sustained demand. Any rule set should be tested across multiple market regimes because decay behavior changes when volatility and liquidity conditions shift.
Key Takeaways
- Breakouts can fail because the initial imbalance runs out and participation declines, which shows up as close failures, volume contraction, and volatility digestion.
- Use a two-stage rule: confirm the break, then confirm follow-through during a hold window.
- Plan exits around decay by invalidating on confirmed closes back through the level or using volatility-based trailing logic.
- Test rules with realistic costs and out-of-sample data, since decay patterns vary across timeframes and regimes.