Understanding Drawdowns
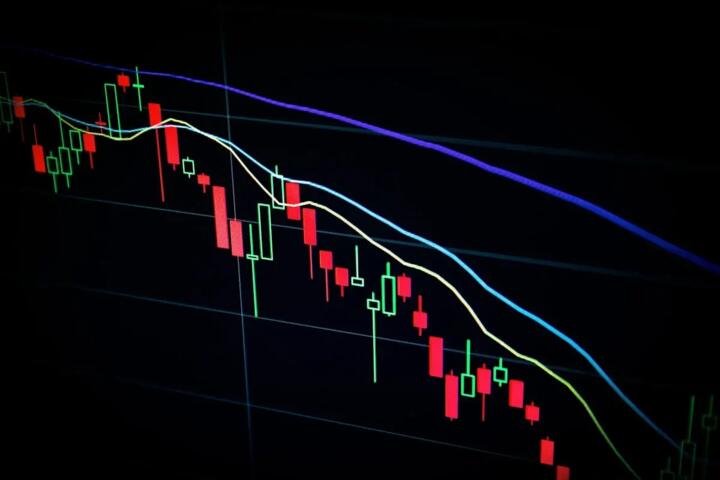
A portfolio drawdown measures the decline from a peak to a trough over a period before a new peak is reached. For example, the S&P 500 faced a 34% drawdown from February to March 2020 during the early COVID-19 crash. Drawdowns quantify actual loss experienced rather than volatility alone. Monitoring drawdowns is crucial because it reveals how much capital investors risk losing over a cycle, not just day-to-day fluctuations.
In practical terms, if your portfolio peaked at $100,000 and later dropped to $80,000, you face a 20% drawdown. This number affects your psychology and capital allocation significantly.
Quantifying drawdowns helps set risk thresholds and informs when intervention might be required to protect your investments.
Drawdown Challenges
Many investors confuse market dips with drawdowns, leading to premature selling or panic behaviors. Ignoring drawdowns or underestimating their duration can lead to catastrophic withdrawal decisions. A 30% loss requires a subsequent 43% gain just to break even—a math detail often overlooked.
During the 2008 financial crisis, amateur investors sold at lows, locking losses when markets rebounded 60% in two years. Holding blindly is no solution; neither is overreacting to every fluctuation. The key mistake is lacking a concrete plan for these inevitable phases.
Drawdowns also impact retirement timelines and income expectations, especially for those withdrawing from portfolios. A sustained 15–20% drawdown can force portfolio rebalancing under unfavorable conditions.
Practical Drawdown Solutions
Set Clear Risk Limits
Determine a maximum acceptable drawdown before portfolio adjustments. A 10–15% threshold suits moderate risk investors. Automatic alerts via brokerage platforms—like Fidelity’s custom notifications—help track drops in real time. You save stress and avoid guessing when to act.
Diversify Across Uncorrelated Assets
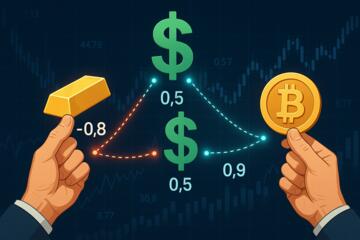
Drawdowns hit less when assets don’t move in tandem. Mixing equities, bonds, and alternatives—such as real estate or commodities—reduces portfolio volatility. For instance, during 2020, while equities plunged 30%, U.S. Treasury bonds gained 7%. Rebalancing back to target weights keeps risk controlled without guesswork.
Use Stop-Loss Orders Judiciously
Strategic stop orders limit losses but often get triggered by normal market noise. Tailor stop-loss levels using historical price action, favoring ranges beyond short-term swings. Systems like Interactive Brokers let users set trailing stops that follow price declines without frequent triggers.
Implement Tactical Allocation
Adopt dynamic shifts in exposure based on market signals. Quantitative trend-following models, like the ones used by Hedge Funds based on moving averages, cut exposure during confirmed downtrends. It’s not perfect, but with a 20% drawdown signal, shifting 30% to cash or bonds can reduce losses by half over downturn periods.
Incorporate Hedging Strategies
Options or inverse ETFs can offset portfolio declines. Protective puts on major holdings cap downside risk. For example, buying a put option on the NASDAQ 100 (ticker QQQ), costs about 2% annually but shields against steep drops, as seen in 2022's tech selloff.
Maintain Adequate Cash Reserves
Holding 5–10% in cash cushions drawdowns and provides buying power to opportunistically increase positions at discounted prices.
Regular Monitoring and Review
Using tools such as Morningstar Portfolio Manager or Personal Capital's dashboard lets you track portfolio peaks and valleys continuously. Weekly reviews capture changes before losses deepen.
Psychological Preparation
Accepting that drawdowns are natural minimizes panic selling. Some investors find journaling their responses helps identify emotional biases that sabotage decisions.
Illustrative Portfolio Cases
A mid-sized family office in 2019 faced a 25% drawdown during the pandemic onset. They shifted from 80% equity to 50%, adding U.S. Treasuries and gold ETFs (like GLD). The drawdown capped at 15% instead of 25%, plus a rebound return of 18% by end-2020.
Another example: A retail investor ignored risk limits, holding 95% in tech stocks. The 2022 tech downturn triggered a 40% loss. After adopting a 20% drawdown stop rule, they moved 40% to bonds (Vanguard Total Bond Market ETF) and ended the year only down 12%.
Drawdown Management
| Step | Action | Purpose | Tools |
|---|---|---|---|
| 1 | Define risk max % | Set loss tolerance | Broker alerts |
| 2 | Diversify investments | Reduce correlation | Multi-asset ETFs |
| 3 | Use stop losses | Limit sudden drops | Broker tools |
| 4 | Tactical shifts | React to trends | Trend indicators |
| 5 | Add hedges | Protect downside | Options, inverse ETFs |
| 6 | Hold cash buffer | Opportunity fund | Money markets |
| 7 | Review weekly | Early loss detection | Portfolio apps |
Mistakes to Avoid
Ignore drawdowns and suffer longer recoveries. React too fast by selling a dip, and you realize losses rather than letting rebounds form. Moving investments without a clear plan often worsens drawdowns. One sees patterns that reactivate fear but miss the bigger picture.
Failing to rebalance periodically lets risk drift upward, potentially increasing future drawdowns unknowingly. Another error is overconcentration in one sector, like tech or energy, exposing portfolios to sector-specific shocks.
Trying complicated hedges without fully understanding them leads to costly errors. For example, many retail investors bought leveraged inverse ETFs in 2022, which, frankly, most people skip after reading the prospectus.
FAQ
What is a portfolio drawdown?
A drawdown is the percentage decline from the highest portfolio value to the lowest point before it recovers.
How often should I monitor drawdowns?
Weekly or monthly checks balance responsiveness and noise, using tools that track peak-to-trough drops.
Are stop-loss orders effective for drawdowns?
They help limit losses but can trigger unnecessarily during normal volatility if set too tight.
Can diversification eliminate drawdowns?
Diversification reduces but does not remove drawdown risk; all assets can decline during crises.
Should I sell during a drawdown?
Not automatically; decisions depend on your drawdown limits, market signals, and investment plan.
Author's Insight
Having managed portfolios through multiple recessions, I learned that prepping for drawdowns before they surface saves wealth and nerves. One tactical shift I applied in 2020 cut losses by nearly 10 percentage points compared to buy-and-hold peers. Tools like Thinkorswim with custom alerts and disciplined review routines help build a buffer. Most investors underestimate emotional resilience, so practicing responses during smaller dips prepares you for larger hits.
Key Points
Drawdowns measure actual capital loss, teaching when to act if losses cross set pain points. Prevent deep losses through clear risk limits, diversified assets, tactical shifts, and hedging. Regular monitoring avoids surprises, while psychological readiness stops rushed decisions. Avoid common errors like overreacting or failing to rebalance. Managing drawdowns protects capital and allows smoother recovery when markets climb again.